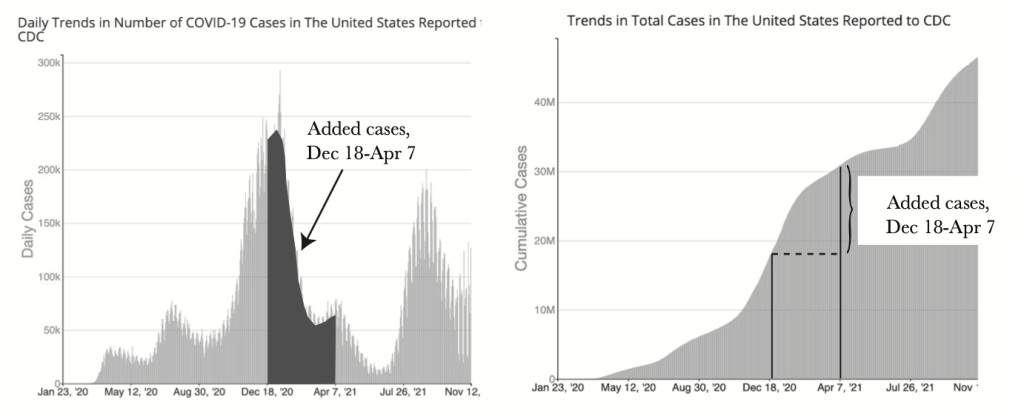
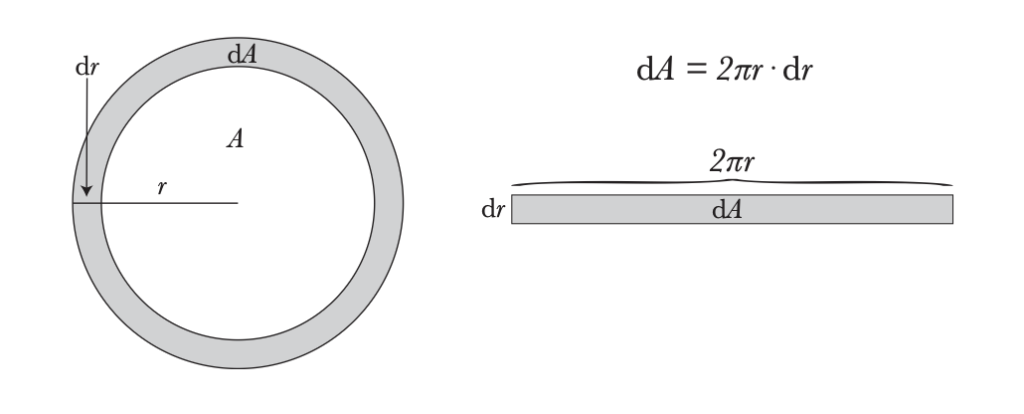
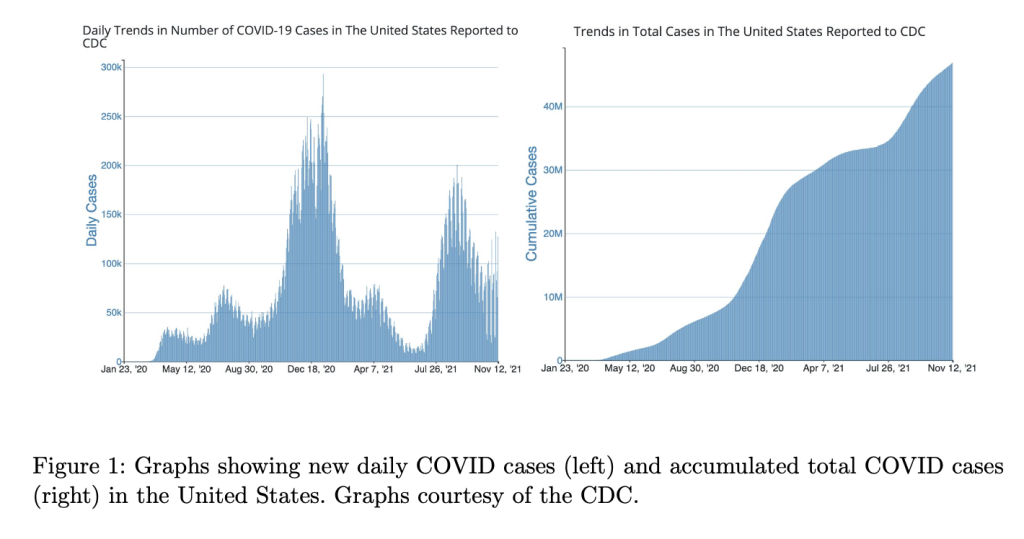
In the first post in this series, I said that calculus is the branch of math dedicated to understanding rate of change and accumulated change. In that post, I Illustrated two relationships between the graphs of cumulative COVID cases and daily COVID cases.
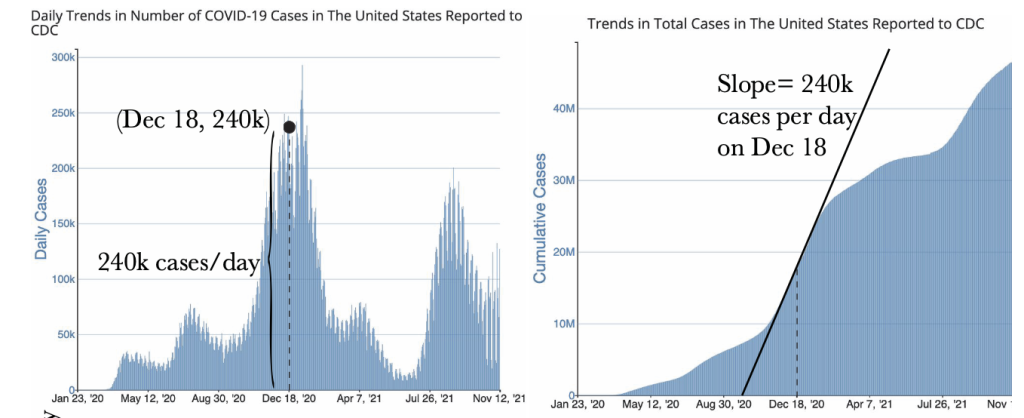
First, the slope on the graph of cumulative cases on a given day is the same as the corresponding value (y-value) on the graph of daily cases:
Second, an area between two dates on the graph of the daily case rate equals the change in the value between the same two dates on the graph of cumulative cases.