Author: Andy Cantrell

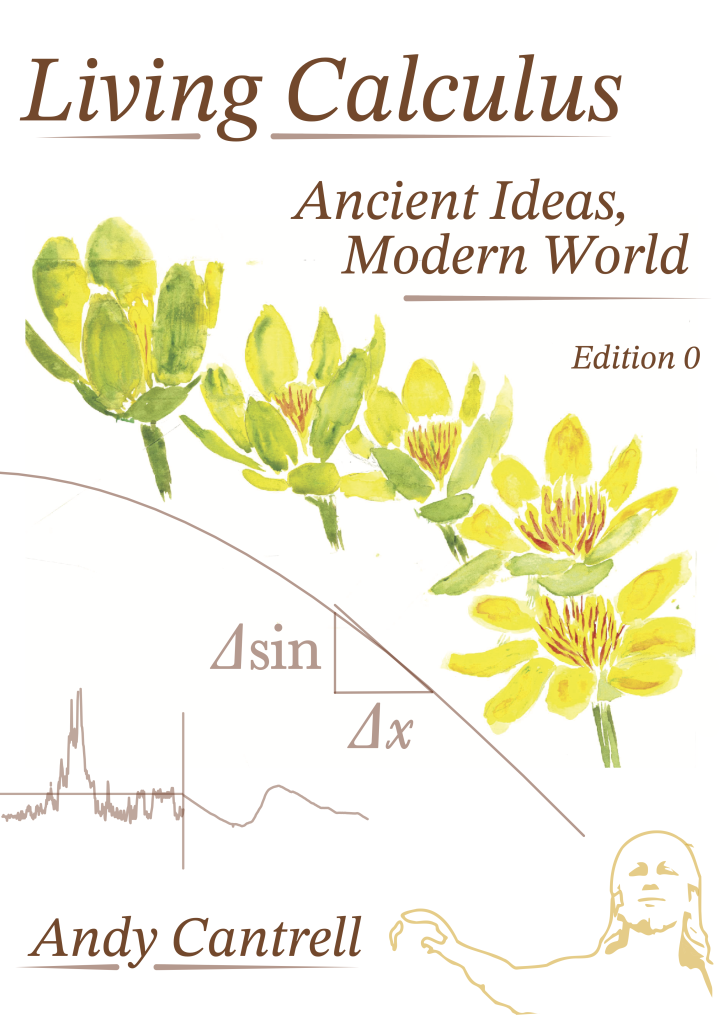
  • About the Cover of Living Calculus

    I painted the opening flower on the cover to be a visual representation of growth and change. It is a symbol of calculus as a vibrant and living field, and also a symbol of the dynamic world that calculus helps us understand.

    The image in the lower-right shows the Indian astronomer Aryabhata, the first person known to have taken a derivative, looking up at a modern representation of his work with the sine function. The image was produced in Adobe Illustrator, based on a photograph of a sculpture of Aryabhata.

    The graphs in the lower left illustrate the connection between the volume and flow rate through Lake Granby, a reservoir in Colorado. They represent the important role calculus can play in understanding modern issues such as our changing water supply.

  • Problems to Introduce Substitution

    One of the most useful mathematical insights I gained from working as an astronomer is that the bounds in an integral are inextricably linked to the variable of integration, and that this plays an absolutely critical role in integration by substitution. Changing the bounds when you change the variable isn’t just a shortcut or a convenience: it is an essential part of the process of substitution. And it makes total sense if we look at substitution in a physical context in which we change between two variables that actually mean something to us. The problems linked here introduce substitution by placing it in a physical context and clarifying what it really means to change the variable of integration.

    (more…)
  • Visualizations of the Fundamental Theorem

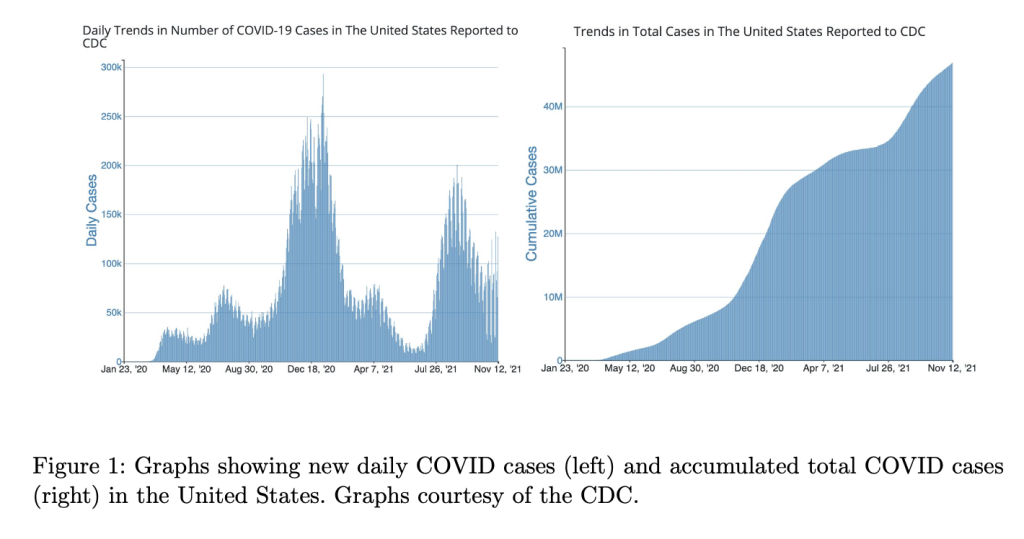
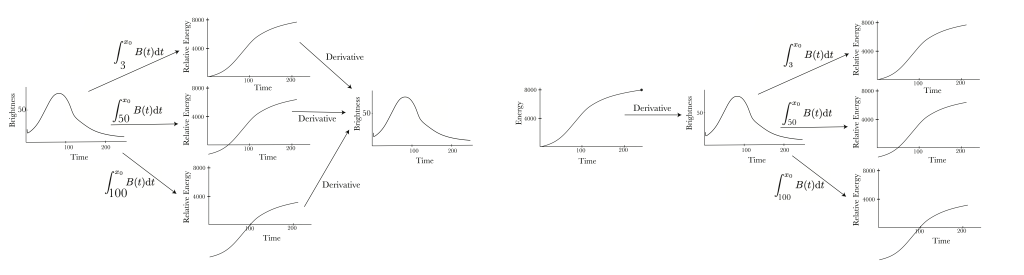
    Suppose you have done this activity, which has students use a numerical derivative to produce a growth-rate graph based on CDC growth charts. And suppose you have also done this sequence of activities, which introduces students to integration using the energy released by a supernova and culminates in the computation of an accumulation function, showing cumulative energy over time. And perhaps you’ve also had students do this problem, which gets them thinking about the connection between accumulation and rate in the context of COVID. If so, then your students have seen all three pairs of graphs shown below.

    (more…)
  • Signed Area and the Definition of the Definite Integral

    There is a long-standing tradition of defining integrals as being area and introducing accumulation as an application of this core mathematical idea. What happens if, instead, we define integrals as being accumulation and then link this idea to area? For example, I use this activity to introduce Riemann sums by first having students estimate the total energy released by a supernova over a period of time, and then leading them represent their work in terms of area.

    This approach has a clear benefit to student buy-in: students are likely to find accumulation problems more intrinsically interesting than areas. It also has a benefit in terms of giving students some intuition for integrals. For example, in the graphs above, students find it intuitive that the volume graph is steep when the flow rate graph has a large value. There is also a strong historical case for foregrounding accumulation: Newton was certainly more interested in motion than in area per se, and Babylonian astronomers tracking the motion of Jupiter were among the very earliest to use Riemann sums.1

    But you may be wondering: is this rigorous? Shouldn’t integrals be defined in terms of a mathematically clear idea like area, rather than a more ill-defined one like accumulation? This post focuses on the theoretical benefits of foregrounding accumulation. I would argue that foregrounding accumulation actually leads to a more theoretically rich (and more rigorous) framework for understanding Riemann integrals.

    (more…)
  • Numerical Derivatives and the Mean Value Theorem

    As I outlined in an earlier post, it is challenging to give first-year calculus students a compelling reason to care about the MVT. Its theoretical importance is often lost on this audience: using the MVT to prove the Increasing Function Theorem often creates confusion rather than providing clarity. And the sorts of “applications” often introduced to a first-year class feel contrived: the classic “cop giving a speeding ticket” example is amusing, but it hardly conveys the importance of this theorem.

    However, if you’ve spent some time (even just a couple classes) with numerical derivatives, then the MVT has a clear and important meaning. Indeed, the MVT gives the answer to important questions students have likely been asking since they first encountered numerical derivatives. Before posing these questions, let’s take a brief detour to review numerical derivatives.

    (more…)
  • On Teaching the Mean Value Theorem (part 1)

    The Mean Value Theorem (MVT) is a central piece of a first class in calculus. However, the role it plays in the class is often not clearly defined. In many classes and books, students are told that the MVT is the “backbone of calculus,” or some such thing: it is the foundational result on which many important things are built. From the standpoint of analysis, this is a reasonable claim: the MVT and extensions of it are essential to proving everything from the Increasing Function Theorem (IFT) to some of the more general versions of L’hospital’s rule. But how does this come across to a typical calculus student? Such a student has not yet taken a course in analysis and lacks the context to see why the MVT is so manifestly important.

    (more…)
  • Growth Charts and Numerical Derivatives

    One of my favorite start-of-the-year activities is to have students produce a growth rate graph from the CDC growth chart for children. Here is a link to a student-facing version of the activity, which you are free to copy and adapt for use in your class1. And here is a quick-start guide to using this activity in class.

    This activity has students compute slopes using both difference quotients and tangent lines. It asks them to abstract the difference quotient (in spreadsheet notation), so that it can be computed quickly for hundreds of data points. It gets them warmed up to the idea of viewing slope as a function, illustrating a situation where graphing slope as its own function is quite illuminating. It helps them see how a function relates to its derivative and prepares them for interpreting derivatives in the future, both in applied contexts and in curve sketching.

    The graphs below2 give a quick sense of how this activity turns out. Students start with the graph on the left (data from the CDC), and end up producing the graph on the right. Features that are barely visible on the left become obvious on the right, for example the incredibly rapid growth of 2-year-olds and the growth spurt around age 12. Truly, the growth rate graph gives a much richer sense of how human growth varies throughout childhood.

    The right edge of the growth rate graph also illustrates how a function can continue to increase even if its derivative decreases. Every year, I say to my students after they do this: “the rate of growth graph drops off pretty fast after age 12. Does that mean the person is shrinking?” And they immediately say, “no, it means that they’re growing more slowly.” In this context, students see that this makes sense: the declining growth rate corresponds to a flattening slope, not to a decreasing height. Later in the year, I remind them of this every time someone gets confused about the distinction between decreasing f’ and decreasing f.

    (more…)
  • An Alternative Proof of the Increasing Function Theorem

    The Increasing Function Theorem (IFT), which connects positive derivatives and increasing functions, is absolutely foundational to a first course in calculus: for example, it justifies the use of the first derivative test for extreme values. The theorem feels intuitively obvious (positive slope means increasing, right?) but proving it is harder than one might expect. For this reason, many books “prove” the IFT using the Mean Value Theorem (MVT). But this can hardly be called rigorous if the MVT is left unproved? Even worse is to prove the MVT using the Extreme Value Theorem, but then leave that unproved. If we’re going to tell students to be suspicious of their intuition, we need to give them something better in its place.

    One can simply say to students “the IFT is true, but its proof is harder than you might expect. It is not easy to relate the properties of a function across a whole interval to its properties at individual points in that interval.” Then there is no need to muddy the waters using unproved theorems to justify a claim that students probably found intuitive in the first place.

    (more…)