In the first post in this series, I said that calculus is the branch of math dedicated to understanding rate of change and accumulated change. In that post, I Illustrated two relationships between the graphs of cumulative COVID cases and daily COVID cases.
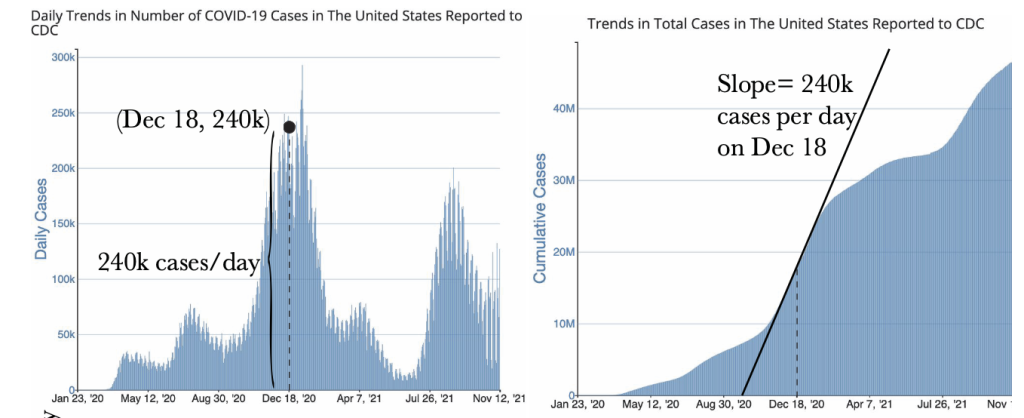
First, the slope on the graph of cumulative cases on a given day is the same as the corresponding value (y-value) on the graph of daily cases:
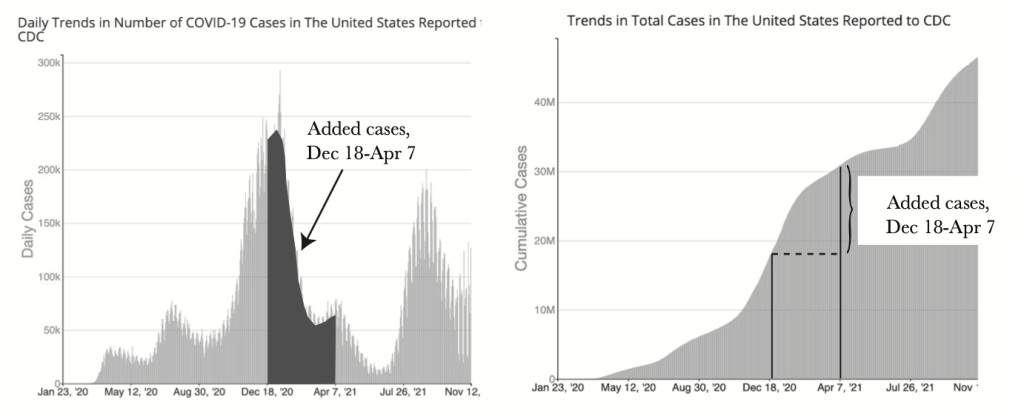
Second, an area between two dates on the graph of the daily case rate equals the change in the value between the same two dates on the graph of cumulative cases.
In the second and third posts in this series, I discussed why the perimeter of a circle, \(\scriptsize 2\pi r\) equals the rate of change in its area, \(\scriptsize \pi r^2\): for a small change in radius, the perimeter equals the rate of added area per unit added to the radius.
How does the example with perimeter and area relate to the graphical concepts illustrated on the COVID graphs? Well, the graphs of area (\(\scriptsize A(x)=\pi x^2\)) and perimeter (\(\scriptsize P(x)=2\pi x\)) have the same two relationships as the graphs of daily cases and cumulative cases:
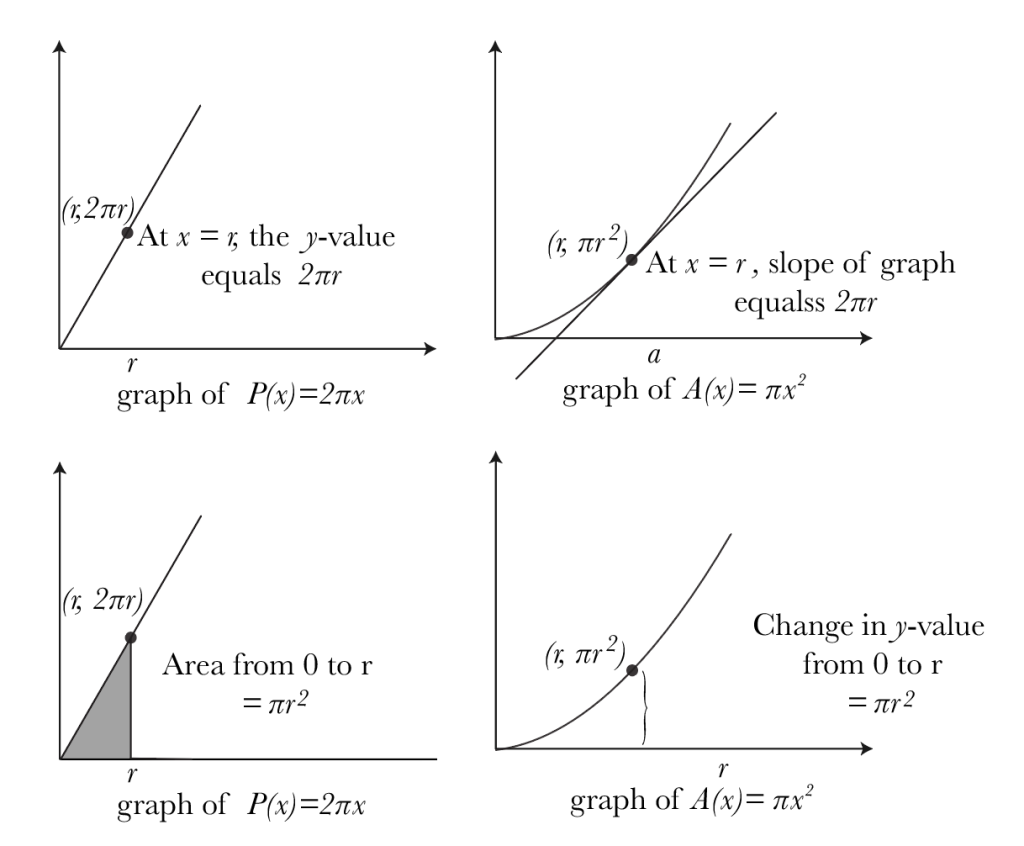
Just as slope on the cumulative case graph corresponds to the value on the daily case graph, it is also true that slope on the area graph corresponds to value on the perimeter graph.
And, just as area on the daily case graph corresponds to change in value on the cumulative case graph, it is also true that area on the perimeter graph corresponds to change in value on the graph of area.
Check both of these for yourself: the area on the left is a triangle with base \(\scriptsize r\) and height \(\scriptsize 2\pi r\); thus, the shaded area is \(\scriptsize \pi r^2\), equal to the change in y-value from 0 to r on the right. And, standard derivative rules tell us that \(\scriptsize 2\pi r\) is the slope of \(\scriptsize \pi x^2\) at \(\scriptsize x=r\).
If you like this and want a copy of my whole book, please click here