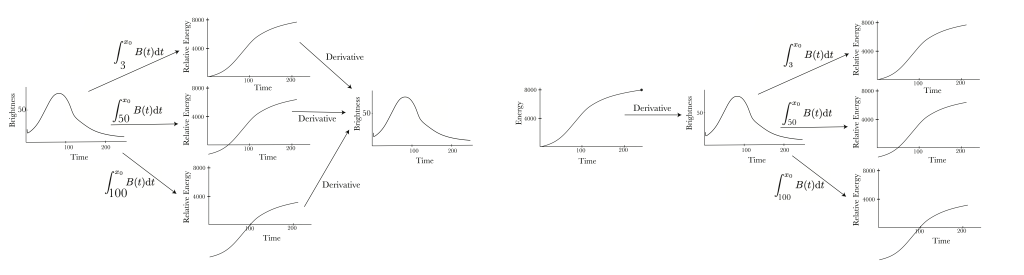
Suppose you have done this activity, which has students use a numerical derivative to produce a growth-rate graph based on CDC growth charts. And suppose you have also done this sequence of activities, which introduces students to integration using the energy released by a supernova and culminates in the computation of an accumulation function, showing cumulative energy over time. And perhaps you’ve also had students do this problem, which gets them thinking about the connection between accumulation and rate in the context of COVID. If so, then your students have seen all three pairs of graphs shown below.
(more…)