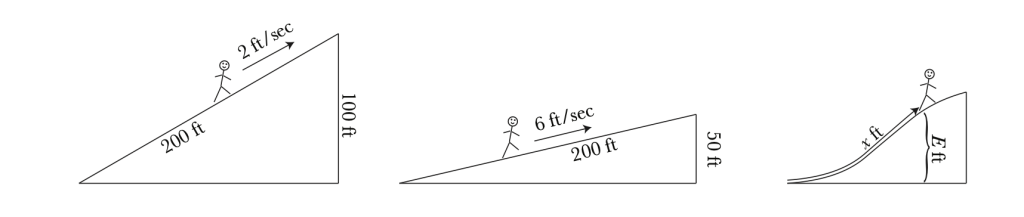
In my last post, I described the importance of drawing a clear connection between the idea of related rates and the concept of a composed function. In this post, I will describe a way to introduce the chain rule using related rates. I like to think that this is the “this actually makes sense” intuition for the chain rule that many people wish they had and many calculus teachers wish they could convey. Sam J Shah has another take on how to make the chain rule approachable, which is a bit more mathematical and a bit less physical.
We have someone walking up a hill, so that their elevation is a function of position which, in turn, is a function of time. How fast are they gaining elevation?
I’ve tried producing a document giving some guidance to help others use a few of my favorite problems in their classroom. This includes problems I use on the chain rule, product rule, fundamental theorem and power rule. My goal with this document is to explain some of what I do to set each problem up and debrief it at the end of class, and to describe what comes before and after a particular problem.
There aren’t that many problems that I wrote in my first year and that have survived untouched since that time. But this collection of area problems regularly puts a smile on my face when I get to it. These problems are simple, but they do a surprisingly good job of getting students to think about the connections between antiderivatives and signed area.
Almost all calculus classes start with limits. The consensus seems to be that it is impossible to discuss derivatives or integrals without first discussing limits. But of course, calculus without limits is possible: it is just numerical calculus.
Instead of asking “how can you talk about calculus without limits,” this post will argue that we should instead ask “how can we expect students to engage thoughtfully with limits unless they first see a problem where they are needed?”
One of the most useful mathematical insights I gained from working as an astronomer is that the bounds in an integral are inextricably linked to the variable of integration, and that this plays an absolutely critical role in integration by substitution. Changing the bounds when you change the variable isn’t just a shortcut or a convenience: it is an essential part of the process of substitution. And it makes total sense if we look at substitution in a physical context in which we change between two variables that actually mean something to us. The problems linked here introduce substitution by placing it in a physical context and clarifying what it really means to change the variable of integration.
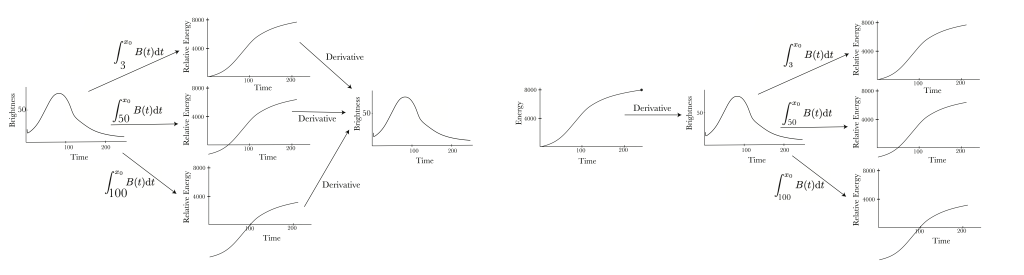
Suppose you have done this activity, which has students use a numerical derivative to produce a growth-rate graph based on CDC growth charts. And suppose you have also done this sequence of activities, which introduces students to integration using the energy released by a supernova and culminates in the computation of an accumulation function, showing cumulative energy over time. And perhaps you’ve also had students do this problem, which gets them thinking about the connection between accumulation and rate in the context of COVID. If so, then your students have seen all three pairs of graphs shown below.
One of my favorite start-of-the-year activities is to have students produce a growth rate graph from the CDC growth chart for children. Here is a link to a student-facing version of the activity, which you are free to copy and adapt for use in your class1. And here is a quick-start guide to using this activity in class.
This activity has students compute slopes using both difference quotients and tangent lines. It asks them to abstract the difference quotient (in spreadsheet notation), so that it can be computed quickly for hundreds of data points. It gets them warmed up to the idea of viewing slope as a function, illustrating a situation where graphing slope as its own function is quite illuminating. It helps them see how a function relates to its derivative and prepares them for interpreting derivatives in the future, both in applied contexts and in curve sketching.
The graphs below2 give a quick sense of how this activity turns out. Students start with the graph on the left (data from the CDC), and end up producing the graph on the right. Features that are barely visible on the left become obvious on the right, for example the incredibly rapid growth of 2-year-olds and the growth spurt around age 12. Truly, the growth rate graph gives a much richer sense of how human growth varies throughout childhood.
The right edge of the growth rate graph also illustrates how a function can continue to increase even if its derivative decreases. Every year, I say to my students after they do this: “the rate of growth graph drops off pretty fast after age 12. Does that mean the person is shrinking?” And they immediately say, “no, it means that they’re growing more slowly.” In this context, students see that this makes sense: the declining growth rate corresponds to a flattening slope, not to a decreasing height. Later in the year, I remind them of this every time someone gets confused about the distinction between decreasing f’ and decreasing f.