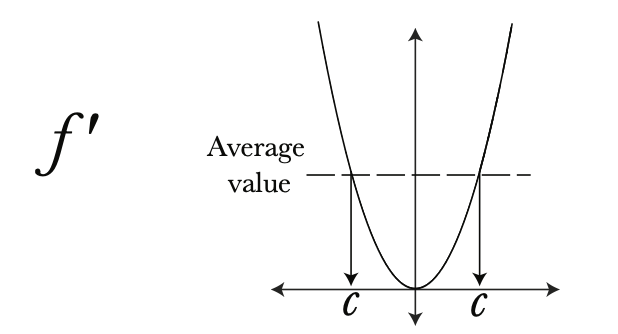
If your students have seen that (for a differentiable function on a closed interval) the average rate of change of f always equals the average value of f’, then you are ready to show them a nice way of visualizing the Mean Value Theorem. I think almost every calculus teacher illustrates the MVT with a picture something like this one:
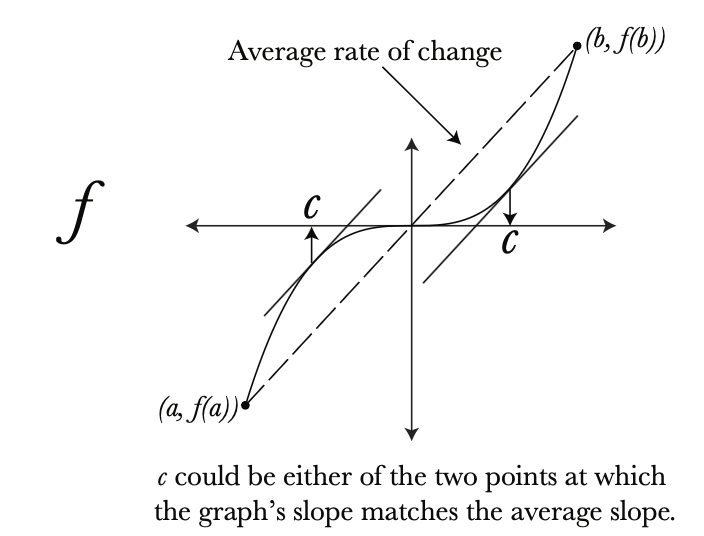
Here, we can see the point(s) at which the average rate of change matches the instantaneous rate of change. If we view the same situation from the perspective of f’, then we get this picture: